Range: Maximum value – Minimum value
Example:
5, 10, 18, 21, 34, 2, 9, 10, 18, 34, 3, 14, 25, 3, 27
Maximum value = 34
Minimum value = 2
Range = 34 – 2 = 32
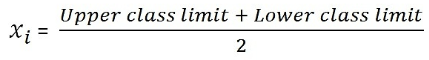
Class mark = (Upper class limit + Lower class limit)/2
Mean of Raw, Discrete and Grouped Data:
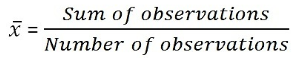
Mean of Raw Data:
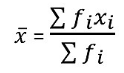
Mean of Discrete Data:
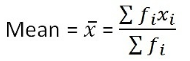
Mean of Grouped Data:
There are three methods to obtain Mean of Grouped Data
(i) Direct Method
(ii) Assumed Mean Method
(iii) Step-Deviation Method
Direct Method:
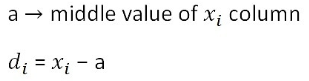
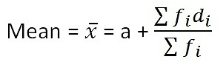
Assumed Mean Method:
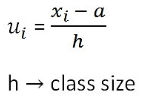
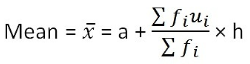
Step-Deviation Method:
Median of Raw, Discrete and Grouped Data
Median of Raw Data
Write data in ascending/descending order
N = Total Number of observations
(i) If N is odd

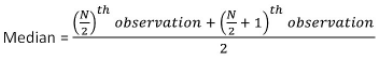
(ii) If N is even
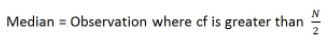
Median of Discrete Data:
First, we find cumulative frequency (cf)
Then, we find N/2
Where N = total number of observations
(i) If N is odd
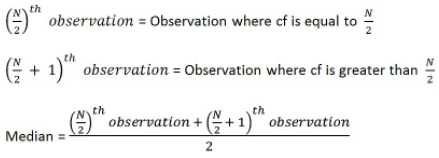
(ii) If N is even
Median of Grouped Data:
We use the formula
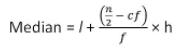
Where
Median class = class with cumulative frequency greater than N/2
l = lower limit of median class
h = class size
f = frequency of median class
cf = cumulative frequency of class preceding median class
Mode of Raw Data:
We follow these steps
- Arrange in ascending or descending order
- Find the element occurring max number of times
⸫ Mode = Element occurring maximum number of times
Mode of Discrete Data:
Mode is the data which occurs maximum number of times,
⸫ Mode = Data with maximum frequency (fi)
Mode of Grouped Data:
We use the formula
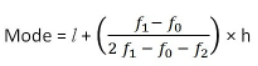
Where
Modal class = Class with highest frequency
l = lower limit of modal class
f = frequency of modal class
f0 = frequency of class preceding modal class
f2 = frequency of class succeeding modal class
h = class size
Empirirical Relationship between Mean, Median and Mode
Mode = 3 Median – 2 Mode